
An image on your screen is actually made up of lots and lots of little tiny squares, each one with its own color (a pixel). We don’t see the little squares unless the image is enlarged to the point where it is no longer smooth.
Counted cross-stitched images are created by sewing x-shaped stitches, in specific colors, inside little squares that are formed by the weave of the base cloth. The images are ‘pixelated’ so it makes sense that there is a free tool for cross-stitchers to make a pixelated chart of any image.
Even if you are not a cross-stitcher, this is a cool tool. In fact, it was a quilter in my class last week who shared the site with me (thank you, Lucy!). She is making a quilted portrait of her granddaughter from little squares of fabric that she is coloring with the help of the chart she made on My Photo Stitch.
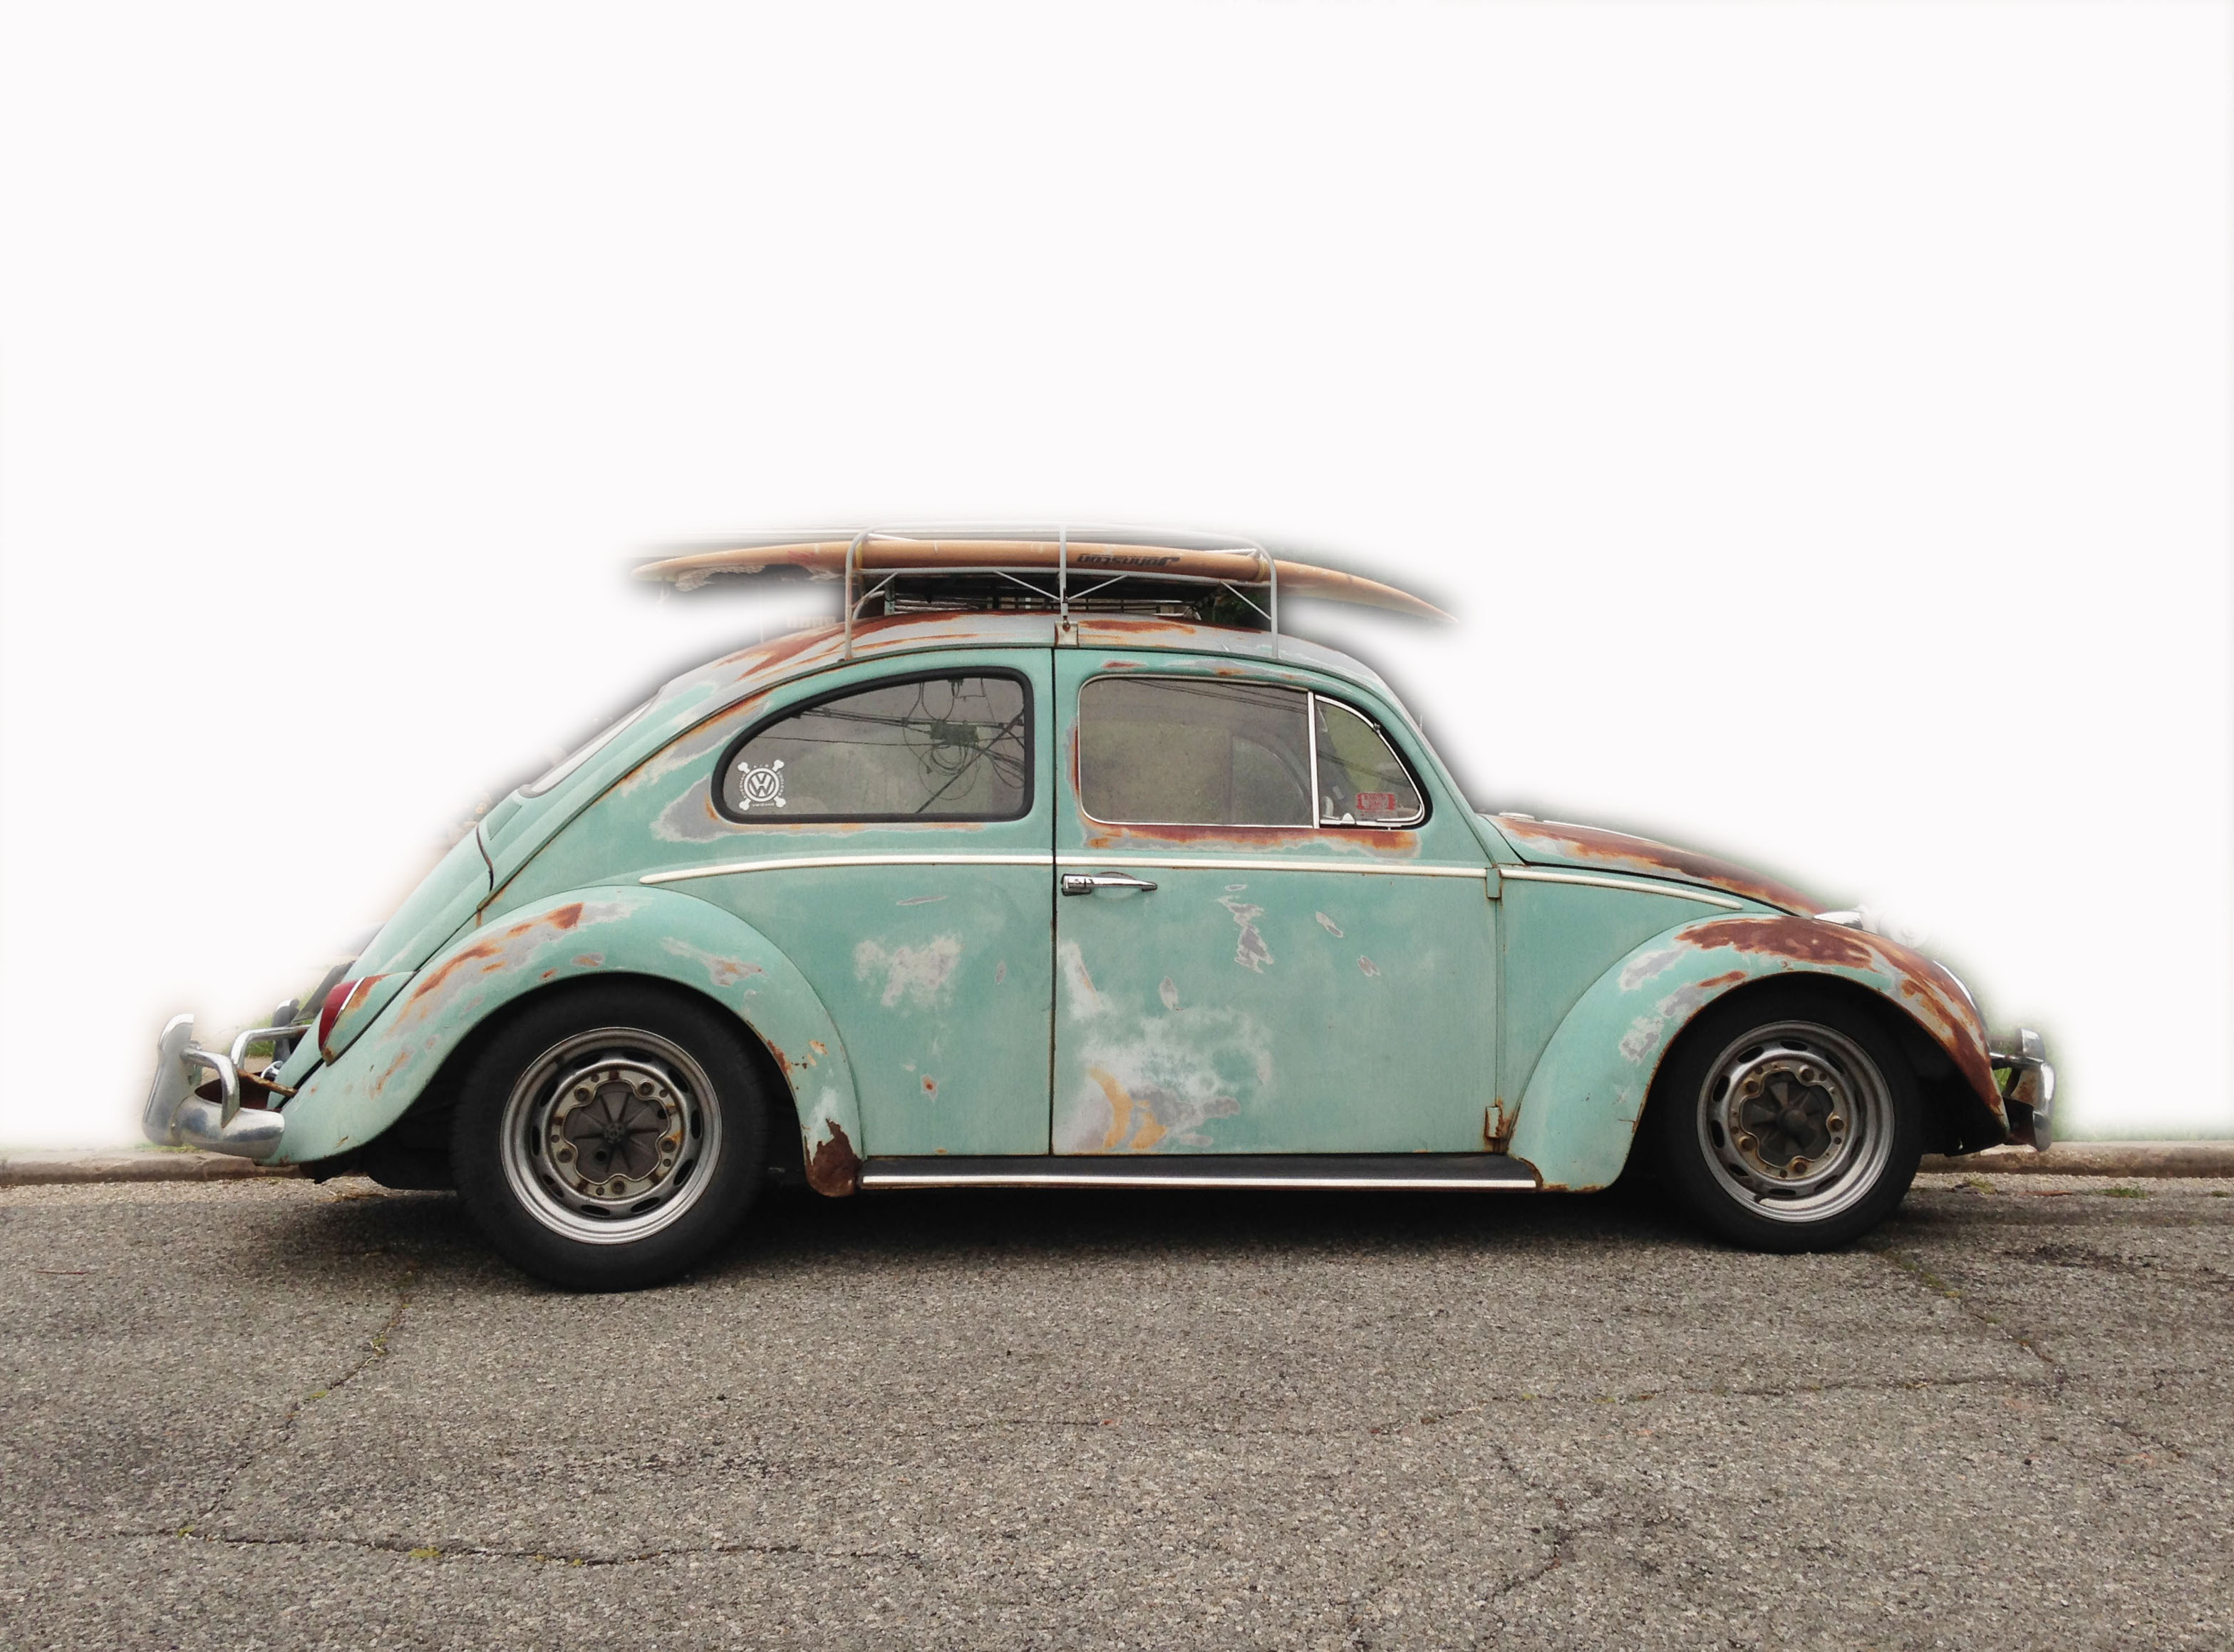
Here’s how it works: Go to myphotostitch.com and click the try it free button. I used the VW Bug image from last week’s blog post…
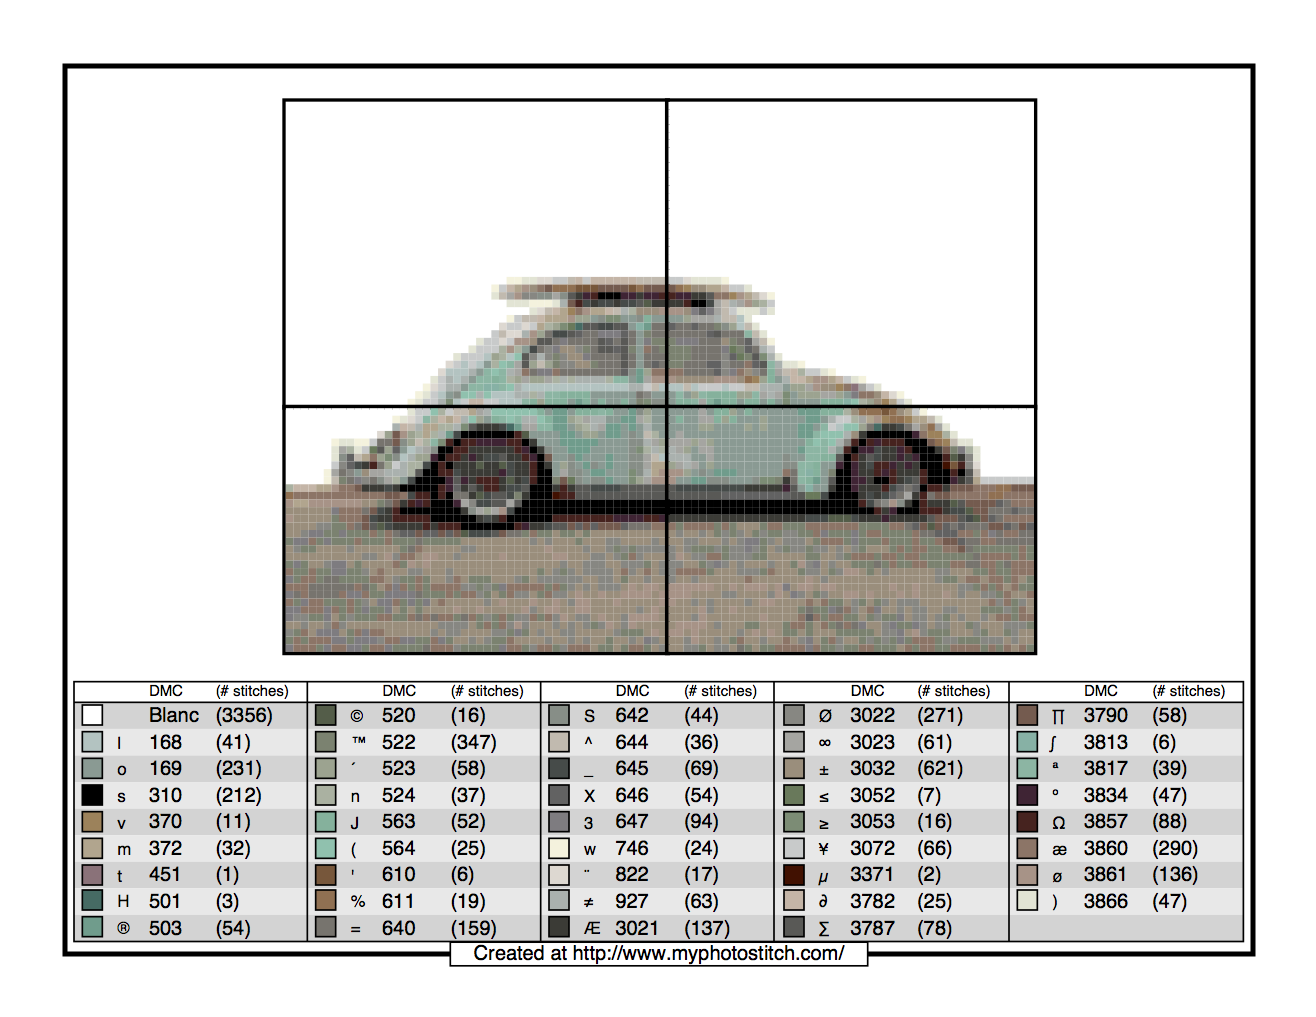
Myphotostitch.com generated the following pattern and thread chart.
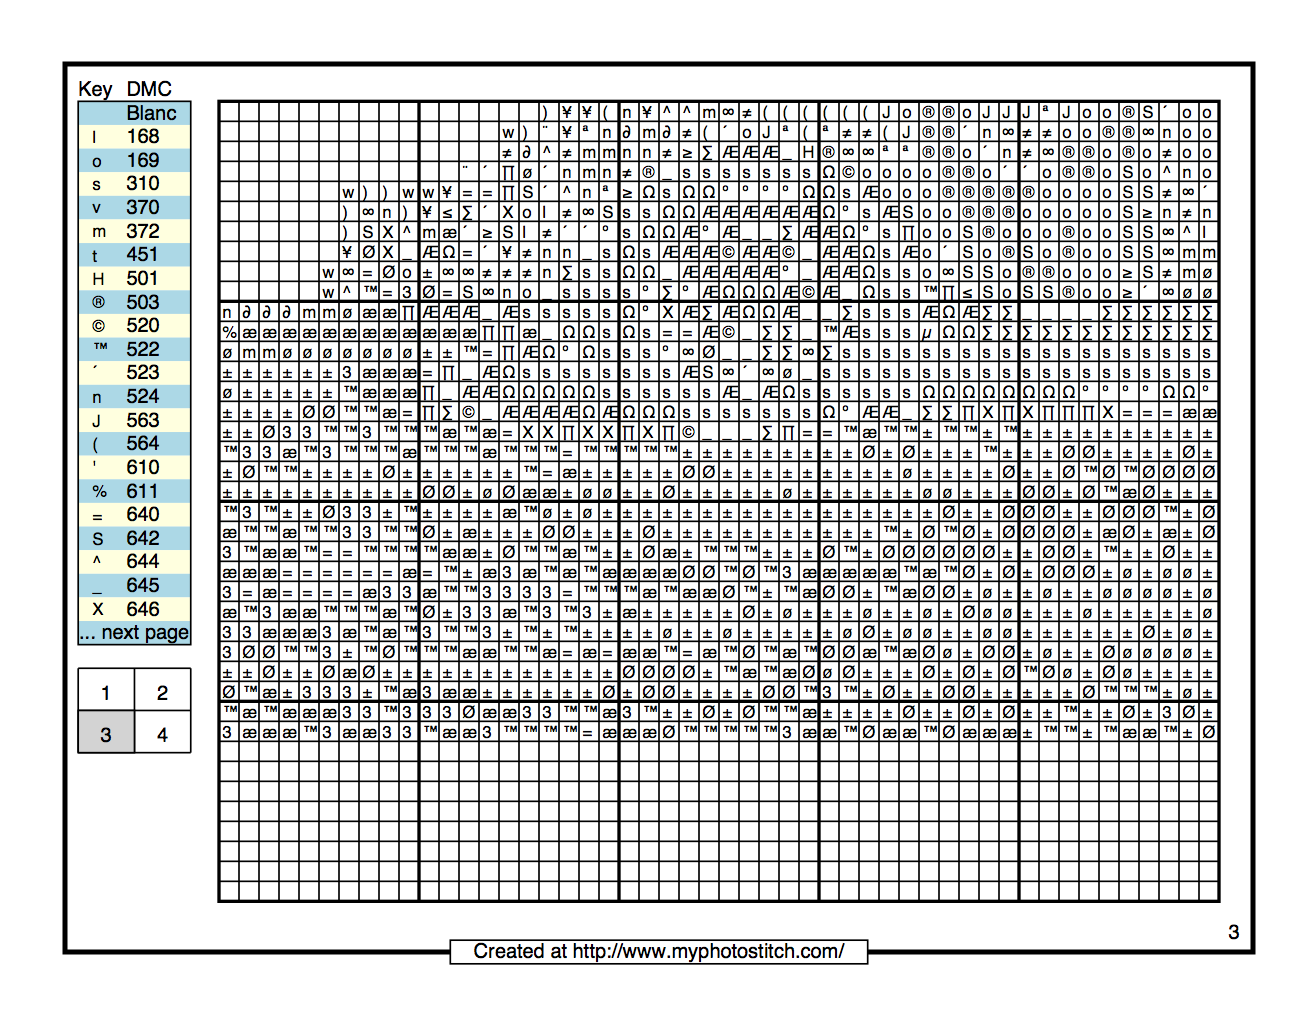
This is one of the pages with 1/4 of the chart, showing where each color goes.
It’s always nice to find another tool for the toolbox :-).


This is SO cool!!!!
LikeLike
My thoughts exactly!
LikeLike
Can you pick the size of the pixel, so you can end up with fewer colors? I guess I could answer my own question and go look, huh… 🙂
LikeLike
Yes, I believe you can.
LikeLike
Another good one is AndreaMosaic. One of our guild members made a quilt that was 200 x 200 1/2″ squares (40,000 squares) and she was able to scan her fabric choices in and the program created a chart using her fabrics!
LikeLike
Cool!
Sent from my iPhone
>
LikeLike
This is so cool! Thanks for sharing. Always thanks for sharing!
LikeLike